Language within Political Boundaries
“The limits of language mean the limits of the world.” – Ludwig Wittgenstein
This week in #socialtipsandtricks, we evaluate the Language Tool in your dashboard. Statistics show that 72.5% of the world is monolingual, or can speak and understand one language. Even though a country may have an official/ or most commonly used language, does not mean that all citizens are represented in that dialect.
For the example today, we will be diving deep into the United States. Let’s pretend that the Content Marketing Team needs analytics and demographics geared toward the DOC, diabetes online community, that live in the United States. Specifically, they want to know:
What are the top 3 language campaigns needed to personalize marketing efforts directed at the target audience in the United States?
Prior to using Social Studio, conducting secondary research is needed to understand language within the political boundaries of the United States and how the influences from the neighboring countries, Mexico and Canada, may have an impact on dialect. Here are a few results:
- There is NO official language in the United States.
- English, Spanish, and Chinese are the top 3 languages spoken in the United States.
- According to the US Census, there are over 350 represented in the United States.
Now that a few basic language statistics from the United States are known, it is time to utilize Social Studio. For our demonstration, I click on the Overall Diabetes Dashboard.
- I need to customize my dates. I select the dates for Q1 2018 for a wider range of data.

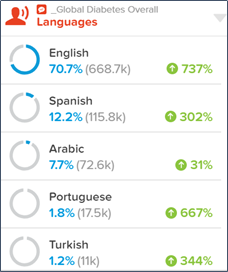
- Next, I scroll down and find the Language Tool. .
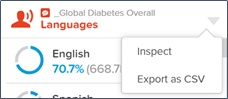
- I recognize that this is a great place to start, but need more specific numbers to return to my Content Marketing Team. I find the arrow drop down box and export data as CSV.
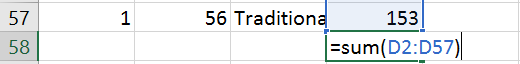
- A report is generated automatically, and Microsoft Excel opens on my computer. I notice that 56 different languages are detected.
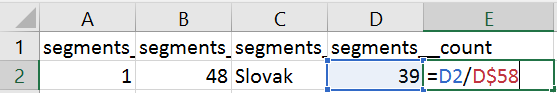
- From here, I want to find volume of posts for Q1. After the last number in Column D, or [segments_count], I enter in the sum function to find a total number which equals brings our quantity of posts for Q1 to 945,435. .
- To find the percentage that each language represents, I enter in the percentage function.
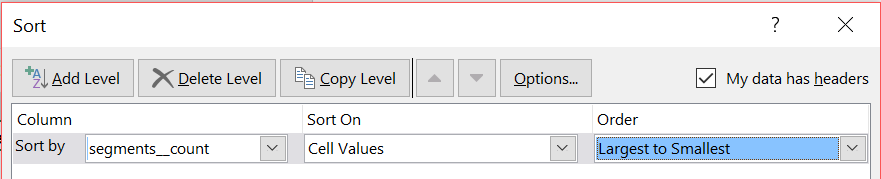
- After rearranging the data, I can clearly see the top 10 languages used within the DOC, in the United States.
- [OPTIONAL] Create a chart, and you are finished!
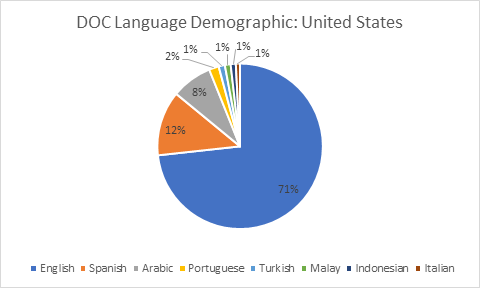
In just a few minutes, I was able to provide figures in real-time to my team. Although my secondary research concluded that English, Spanish, and Chinese were the most frequently used languages in the United States, Social Studio shows the DOC in social media represents English, Spanish, and Arabic as the most commonly used languages.
I can confidently report to my Content Marketing Team that the top 3 languages that should be represented in their campaigns are: English, Spanish, and Arabic. Had the team not applied Social Studio, our campaign would have missed an opportunity with the Arabic community, or 8% of the demographic. Referring back to my excel sheet, the Chinese language ranked 30th.
For a video demonstration of these steps, please click here, or refer to the Knowledge Base: https://digitalmarketing.rochedc.com/hc/en-us/sections/360002405013-Social-Studio-Training-in-5-Minutes-or-Less.
As always, if you have any questions, please either submit a request, or email me directly!