Watch a how to video (4:42)
Create reports to view tracking and engagement metrics for emails sent in journeys over a specified time frame. Choose specific journeys and versions to include in the report. There are three different ways to generate reports for journeys: Journey Builder, Email Studio, and Analytics Builder. Examples of each report are included below
- Analytics Builder – This is the best option because you get all versions of the journey summarized in one report. You must email the report to yourself, because it cannot be viewed on a webpage. It does not produce visual results – just statistics.
- Hover over Analytics Builder on the homepage and select Reports.
- Select Catalog from tabs.
- Search for “journey” in the Search Bar.
- Select
 next to the report of your choice:
- Journey Builder Email Send Summary - Displays tracking and engagement metrics for emails sent in journeys over a specified time frame. Choose specific journeys and versions to include in the report.
- Journey Builder Email Send Summary By Day - Displays tracking and engagement metrics for emails sent in journeys, aggregated by day. Choose a specified time frame, along with specific journeys and versions to include in the report.
- Create Report:
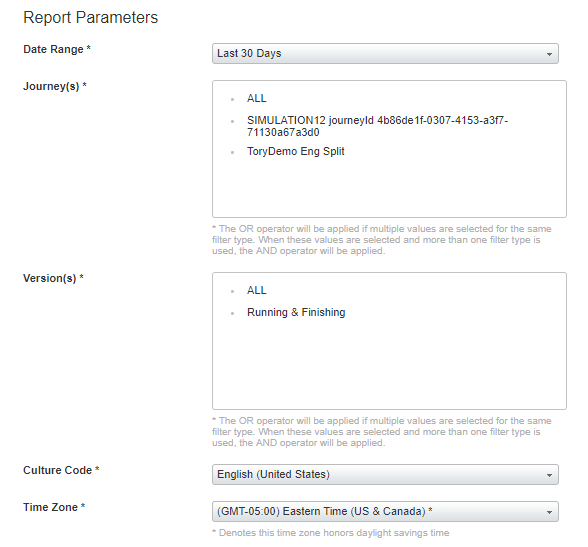
- Date Range – This is date range of the data to include.
- Journey(s) - These are the journeys to include in the report.
- Version (s) - These are the versions of each journey to include. NOTE: IF YOU SELECT MORE THAN ONE OPTION, THE REPORT WILL NOT GENERATE. SELECT ALL OR Running & Finishing. Do not choose both.
- Culture Code – This is the language that the report will be based out of.
- Time Zone – This is the time zone that will be referred to in the report.
- Date Range – This is date range of the data to include.
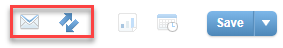
- Select Submit.
- The report cannot be viewed as a webpage. Select a method for delivery:
- Email Results – This is the preferred method. The report will send to email(s) of your choice, optional.
- Filename – Name of the report that will be attached.
- Email Address – Email address that will receive the report.
- Subject – Subject line of email containing report.
- Note to include in Email – Message to include within email, optional.
- Format – Type of file that report will be exported as.
- Filename – Name of the report that will be attached.
- FTP Results – This method uses an FTP tool to load and view the report. You must have FTP credentials. Contact global support for assistance using FTP.
- Email Results – This is the preferred method. The report will send to email(s) of your choice, optional.
- Select Save. Note: The report will take a few minutes to send.
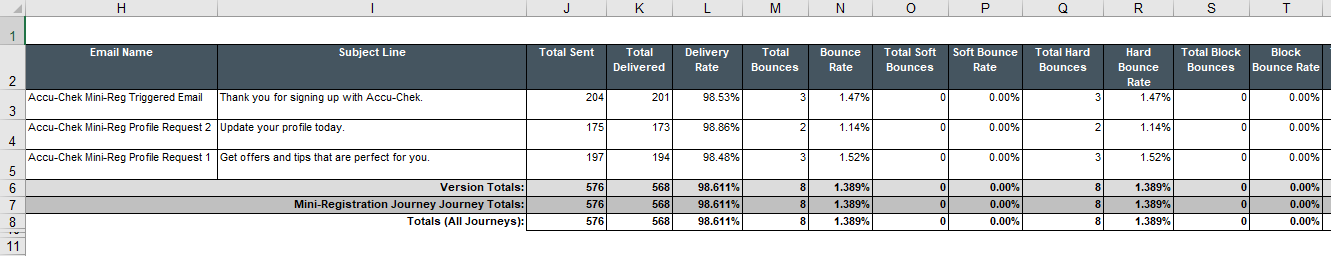
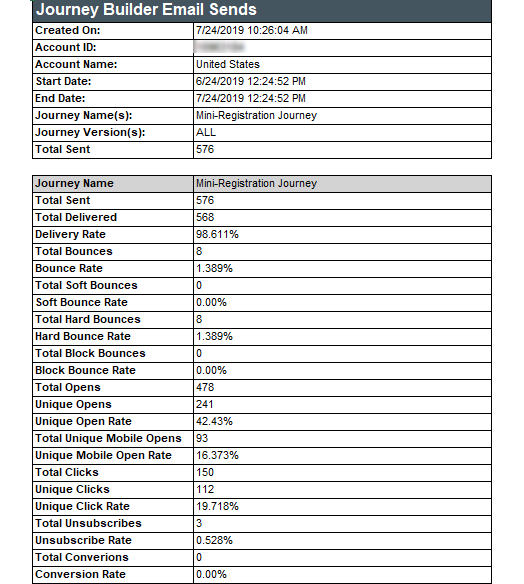
- Here is an Example of an Analytics Builder report:
- Hover over Analytics Builder on the homepage and select Reports.
- Journey Builder – This uses the analytics available within Journey Builder. Analytics are specific to each version of the journey. They are only available for view as a webpage.
- Hover over Journey Builder and select Journey Builder.
- Navigate to and select the journey you would like to view.
- Select
 in the upper right corner.
 - Configure the analytics to view:
- Date – Time frame for which the data pulls from. If the data does not make sense for your journey, the time frame may be too limited. Select to edit. You also have the option to compare to previous time periods.
- Edit – Select Edit to add or remove a component from the report. An example of a component is email analytics.
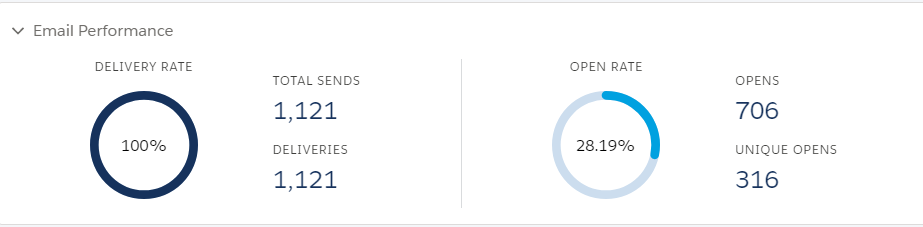
- Email Performance – Analytics for a specific email:
- Delivery Rate – Percent of emails that were delivered. Total Sends refer to the total number of emails that were intended to be sent. Deliveries refers to the number of the total sends that were successfully delivered.
- Open Rate – The percentage of total contacts who received and opened the email. Opens refers to the total number of opens and continues to count if the same contact opens the email multiple times. Unique Opens refer to the number of contacts that opened the email.
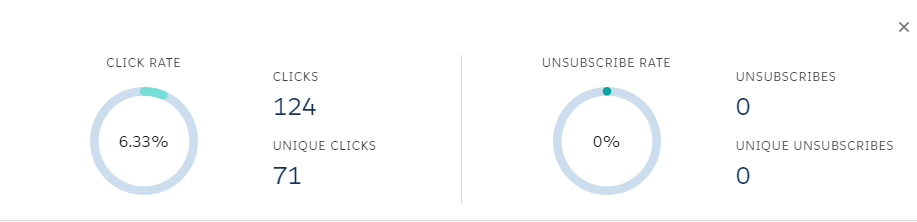
- Click Rate - The percentage of total contacts who received and clicked a link in the email. Clicks refers to the total number of clicks on the link and continues to count if the same contact clicks the link multiple times. Unique Clicks refer to the number of contacts that clicked on a link in the email.
- Unsubscribe Rate – The percentage of total contacts would choose to unsubscribe within this email. Unsubscribes refers to the total number of unsubscribes and continues to count if the same contact tries to unsubscribe multiple times. Unique unsubscribes refer to the number of contacts that clicked on a link in the email.
- Delivery Rate – Percent of emails that were delivered. Total Sends refer to the total number of emails that were intended to be sent. Deliveries refers to the number of the total sends that were successfully delivered.
- To go back to the main page of the journey, select
 .
. - Here is an example of analytics within Journey Builder:
- Hover over Journey Builder and select Journey Builder.
- Email Studio - This uses Email Studio reports available in the Reporting tool. It provides much more visual reports than Analytics Builder. However, it can only view one journey version at a time.
- Hover over Email Studio and select Email.
- Select Tracking.
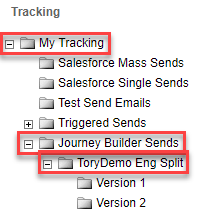
- Select + to extend the My Tracking folder.
- Select + to extend Journey Builder Sends folder.
- Select + to extend the folder of the journey you would like to analyze.
- Select the version you would like to view:
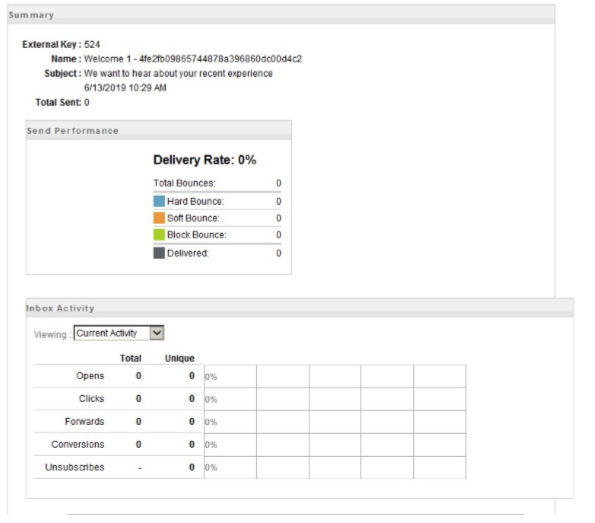
- The report will load in the webpage. To view report as PDF or Excel Spreadsheet, select
 .
.
- Select export type, modules to export, and export delivery method. Note: View in Browser will download the report to your computer.
- Select
 .
.
- Here is an example of an Email Studio Report:
Congratulations! You can successfully generate journey reports.